Understanding the Graphs
There are three groups of graphs displayed in the nephrectomy audit.
- The first group shows the number of times nephrectomy (removal of the kidney) has been performed by a hospital trust or surgeon over a year, so you can see if your surgeon carries out such surgery regularly or rarely. The graphs are sub-divided by the particular procedure, whether it was performed laparoscopically (including hand assisted and robotic) or as an open operation, and whether it was performed for a cancerous (malignant) condition or for a benign one.
- The second group shows the risk-adjusted complications and transfusion rate, actual mortality and length of stay.
- The third, and final, group shows the average patient risk profile, alongside the patient profile risk for the individual surgeon or centre.
Risk adjustment – how and why it needs to be done
Patients vary because of their age, sex and the number of other illnesses they have (known as co-morbidities) as well as because of the extent and severity of their disease, e.g. large tumours involving adjacent organs. Some surgeons / centres may have more complex patients, others may have far fewer. This is known as patient casemix and needs to be taken into account when considering figures such as those shown, because high-risk patients are more likely to suffer complications. In addition, some procedures are inherently riskier than others. The combination of these factors is collectively known as “risk adjustment”.
How is the adjustment done?
The data have been analysed by statistical experts, using complex methods, to take into account many of these factors. The charts shown here display what the rate would have been had each surgeon/centre operated on the average case mix and are dependent on the number of procedures (sample size) actually reported per individual or centre; this is why they change from person to person.
The vertical red lines indicate an acceptable amount of variation (99% and 99.9% alerts). If your surgeon / centre is shown as being within these inner boundaries (i.e. the dark blue bar is to the left of the red lines), then his or her practice is acceptable (see example below). We would look closely at those above the 99% alert. If the dark blue bar is to the right of the 99.9% line, the surgeon is termed an “outlier”, and further investigation is required to determine whether there may be a cause for concern.
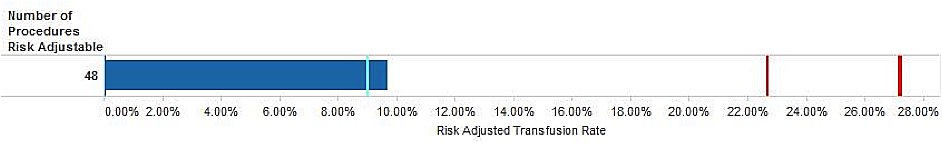
Risk adjusted rate for transfusion
It is important to note that it is not always possible for risk adjustment to tell the whole story. Some surgeons are taking on extremely difficult, challenging surgery on very sick people, who may have relatively high morbidity rates. Others may be developing new techniques. These surgeons may, therefore, appear as outliers although they are the leading specialists in their field.
This dataset was originally set up in 2001 to evaluate the new technique of laparoscopic nephrectomy (keyhole removal of the kidney); it was never the intention to use these data for risk adjustment. Thus, the predictive accuracy (and the ability to risk-adjust every patient) is bound to be less than perfect. Small sample sizes reduce the precision of the risk adjustment and a difficulty with these data is that they are still in their early stages - data publication only began in 2013. We have, however, now added a number of additional questions to the dataset, to help improve this risk adjustment process for future years.
N.B. BAUS has included all the data returned in our overall analysis but, when presenting individual surgeon’s results, we have excluded those surgeons who returned less than five cases for the year because any statistical analysis of such a low number would be invalid.
More detailed information about the methods used for risk adjustment is available by clicking here ("How We Do Risk Analysis").
Average patient risk profile
Some risk factors (e.g. age, haemoglobin levels and other medical problems) can affect the outcome of nephrectomy in terms of complications, length of stay and the likelihood of requiring a transfusion.
The graphs show what percentage of the hospital or Consultant’s patients has each (potential) risk factor. This can indicate whether the hospital / surgeon operates on high-risk patients or, in fact, specialises in peforming complicated surgery such as cytoreductive procedures or major exploration of the vena cava.